Debugging a Strategy
When developing a new strategy, really when working on anything in life, you will very rarely “get it right the first time”. But that’s alright! You just have to keep working on and improving it, until your strategy functions the way you want it to. Fortunately, Naxbot makes it easy for you to do just that.
Error Highlighting
Naxbot’s strategy editor checks your script for errors as you are modifying it and displays the first error it finds on the left-hand side next to the line numbers. Hover over the error symbol with your cursor in order to get more information about what the problem is.
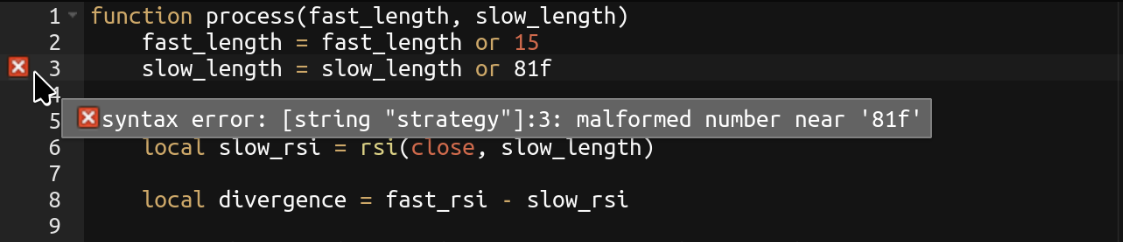
The backend needs to be running & accessible in order for error highlighting to function.
Backtesting
Even if your strategy has no code errors, it may still have some logical errors. Backtesting is not just great for gauging a strategy’s performance, but also helps spot some of those errors. For example, the backtester will warn you if your TP targets or stop loss are misaligned (e.g. you placed your stop loss above the entry price in a long trade), and the summary screen will also be a great indicator if e.g. you are accidentally entering trades at every single candle.
For more information, have a look at the csv file the backtester generates after every backtest, as it contains detailed information about every single trade.
Plotting
On the chart screen, you can choose to plot parts of your strategy either into the main chart, or on a separate chart. This is a great way to check whether you are performing the right calculations.
To do so, simply make a call to the plot function within your process function for the
values you’d like to plot, like so:
function process()
    local my_ema = ema(close, 12)

    -- Simply plot `my_ema` in the default color
    plot("line", my_ema, {})

    return {
        long_entry_condition = constant(false),
        short_entry_condition = constant(false),
        long_exit_condition = constant(false),
        short_exit_condition = constant(false),
        stop_loss = constant(0),
        tp_1 = constant(0),
    }
end
Don’t worry about performance impacts when making calls to plot, as during optimizing and trading, these function
calls are ignored completely.